Characterization of Naturally Fractured Hydraulic Units with Shaly Content
Elkewidy, Tarek I. and Elkewidy, Haisam,T.
[email protected]
Abstract
Natural fractures exist in all kinds of rocks including those with shaly contents. They are more abundant in carbonate rocks, however many of those carbonates contain shale. Natural fracrures may exist, also, in clastic rocks. The vast majority of clastic formations are in reality not shale-free. They usually contain clay minerals in various amounts, types, and distributions. Reliable formation evaluation and estimation of the potential for hydrocarbon production from reservoirs with shaly content is critical and rather a difficult task due to their complex nature.
This study presents a new approach to characterize hydraulic (flow and no flow) units in reservoirs with laminated, structural, dispersed, or general shaly contents including those with natural fractures. Here, reservoirs with shaly contents are characterized by normalizing true formation resistivity in terms of the various shaly correlations. This normalized resistivity is, then, used in a graphical crossplotting technique to yield unique parameters about the hydraulic units. Permeability is estimated for the flow unit with shaly contents using any of three selected/generalized models in terms of the cementation exponent “m”. A new permeability model is also utilized in the characterization process. The concept of Reservoir Quality Index, RQI, is adapted for shaly formations where a Shale Zonation Index, SZI, is uniquely generated to delineate each hydraulic unit. Shale free formation and formation with laminated or dispersed shaly contents are shown to exhibit characteristic slopes within the graphical solution. This paper demonstrates the integration of laboratory information along with conventional well log data to define reservoir bodies with shaly contents at the wellbore and documents the characterization technique. The technique is applicable to shaly clastic and carbonate reservoirs including those with natural fractures.
Introduction
Clay minerals can be found in all kinds of sedimentary rocks including naturally fractured clastic and carbonate reservoirs. However, they are much more abundant in siltstones, sands, and conglomerates. Shaly materials may be distributed throughout the formation in three different ways as revealed by the dipmeter, microresistivity tools, formation microscanner, core analysis, petrographic thin-sections, and scanning electron microscopy. Clay materials can be distributed in a laminated, structural or dispersed fashion. Laminated shales are of detrital origin forming outside the sandstone framework. They occur as thin laminae of clay and other fine-grained materials between which are layers of sand. The laminae themselves do not affect the porosity or horizontal permeability of sand streaks. However, when their amount increases and consequently the quantity of sand decreases, the overall average porosity seen by the logging tools is reduced in proportion. In addition, these laminae are more or less continuous and may act as vertical permeability barriers.
Clay minerals may also be found within the sand framework originating through diagenetic processes. In-situ alternation of non-quartz particles such as feldspar to kaolinite and hornblende to chlorite, due to reaction with formation water, results in the formation of structural clays. This type of clay distribution exists as grains or nodules incorporated within the formation matrix. It may also have a detrital origin, been deposited as clasts or pellets of clay, forming an integral part of a matrix predominated by sand. Structural shale is usually considered to have properties similar to those of laminar and nearby massive shale, and is not expected to affect the formation effective porosity.
However, diagenetic processes usually result in the formation of dispersed clays throughout the sand, partially or completely filling, lining, and bridging pore-pore throat network.1 Dispersed clays develop as crystals precipitate from pore fluids due to changes in formation water chemistry. These diagenetic changes are a result of increasing temperature and pressure accompanied by filtration through shale during burial and compaction processes. Dispersed clays may exist in the porous medium as discrete particles, accumulations adhering and lining the pore-pore throat walls with a continuous thin coating, or intergrown crystals that may bridge a pore or pore-throat. Consequently, dispersed shale can drastically reduce formation permeability.
It is obvious that different clay minerals with different distribution patterns will affect the petrophysical properties of the formation with any kind of pore geometry, i.e, interpartecl, intercrestaline, vuggy, and natural fractures.
Recalling the Set of Equations Characterizing Naturally Fractured Reservoirs (Elkewidy 1996, 2012, and 2013)
 (a)
(a)
![]() (b)
(b)
![]() (c)
(c)
![]() (d)
(d)
![]() (e)
(e)
![]() (f)
(f)
![]() (g)
(g)
In order for the above equations to be applied on naturally fractured reservoirs, the cementation exponent “m” must be accurately determined. It should be noted that “m” must have a value greater than 1.0 and less than 2.0 for naturally fractured reservoirs. However, the presence of shaly contents will increase the tortuosity of the tiny fractures, and that may lead to a high value of “m” for a naturally fractured reservoir, even higher than 2.0. A naturally fractured reservoir may be indicated without fractures due to the presence of shale. So, precautions and adjustments to account for the effect of shale on the value of “m” must be applied. The following sections will discuss the procedures and the proposed methodology.
Conventional Evaluation Techniques for Formations with Shaly Contents
Reservoir effective porosity can be estimated for formations with different shale distribution patterns as follows:
For formations with laminated clay
![]() . ................................................. (1)
. ................................................. (1)
For formations with structural clay
![]() . ........................................................... (2)
. ........................................................... (2)
For formations with dispersed clay
![]() . ........................................... (3)
. ........................................... (3)
Permeability, in turn, has a direct relationship with formation effective porosity. Thus, it will greatly depend on the type and distribution mode of the shale inclusions.2
The basic objectives of evaluating formations with shaly contents are to account for the shale effect on the calculated water saturation values and to develop a realistic log-derived description of the reservoir quality in terms of hydraulic (flow) units having lateral continuity. Several authors have various definitions of a flow unit which is a resultant of the depositional environment and diagenetic processes (facies).3 A hydraulic unit is defined, here, as “a continuous body over a specific reservoir volume that practically possesses consistent petrophysical and fluid properties which uniquely characterize its static and dynamic state distinguishing it from the other rock volumes”.4 Formation fluids may be in hydraulic communication with the wellbore through a flow conduit or compartmentalized within a “no-flow” container. A no-flow unit may also be defined as a reservoir body that does not possess enough porosity or permeability to support fluid storage and/or flow. The subdivision of a reservoir into flow and no-flow units provides a practical mean for zonation which makes use of both geological and engineering heterogeneities observed at the various scales.4 Indeed, shaly contents within the formation are major contributors to reservoir lateral and vertical heterogeneities.
The significant effect of clay minerals, amount, type and distribution on petrophysical log responses is well realized and documented by several investigators.5 Worthington (1985) summarized and classified more than 30 water saturation correlations that have been proposed for shaly-sand reservoirs.6 These correlations can be grouped, generally, into laminar, dispersed, and total shale models. Total shale correlations are those that apply reasonably well to all kinds of shaly reservoirs independent of the shale distribution. Most of these models require a pre-knowledge of the shale or clay volume within the formation. The most commonly used shale volume indicator is usually determined using the gamma ray log.5
The following sections discuss a new characterization technique for shaly formations with different distribution patterns and/or pore geometries (particularly naturally fractured) through adaptation of selected appropriate shaly correlations including total shale models.
Characterization of Hydraulic Units with Laminated Shaly Content
The proposed characterization technique can be implemented through application of two main concepts as follows:
1. Application of Log Porosity Versus Log Resistivity Concept.
Aguilera (1990) generalized Poupon et al. (1954) correlation to evaluate water saturation for formations with laminated shaly content in terms of saturation exponent, n, and cementation exponent, m, as:7
 . ......................... (4)
This generalization extends the correlations to formations with different types of pore geometry, particularly naturally fractured shaly reservoirs. The above equation can be written in a logarithmic form as:
 . ....................... (5)
for 100% water saturation interval where
 . ................................... (6)
Eq. 5 can be also expressed in terms of the bulk volume water concept, for those zones of the hydraulic unit that are at irreducible water saturation, given by:
![]() . ......................... (7)
. ......................... (7)
to yield:
 . ........ (8)
Both Eqs. 5 and 8 can be plotted on a log-log crossplot as shown in Fig. 1. The plot shows two straight lines with slopes of -1/m and 1/(n-m) respectively. So, values for cementation exponent, m, and saturation exponent, n, along with constant C (point L) and aRw (point F) can all be determined for the hydraulic unit provided that the formation has enough zones at 100% Sw and Swi.
At this point, the resulting triangle EFG is a unique characteristic indicator for a specific hydraulic unit with essentially consistent petrophysical properties. Several authors have elaborated on this crossplotting technique discussing its effectiveness, flexibility, and quality controls.4,7,8,9
2. Extension of Reservoir Quality Index Concept to Formations with Laminated Shaly Contents.
Amaefule et al. (1993) discussed the concept of Reservoir Quality Index, RQI, to aid the process of characterizing the formation into its different hydraulic units.3 RQI, which was derived from a generalized form of Kozeny-Carmen correlation, can be written in the form:
 . ........ (9)
where RQI is in micro-meters, permeability in millidarcy, and porosity in fraction. The fraction of the pore space that is water wet, g, is introduced to the above formulation in order to account for the effect of wettability.4 The zonation process of hydraulic units using core data was detailed by Amaefule et al. (1993) and Tiab (1993).10 The process involves correction of porosity and permeability data to net overburden stress and application of statistical techniques including histogram/frequency diagrams, normality tests, cluster analysis, and error analysis. These suggest the importance of obtaining in-situ petrophysical measurements at reservoir conditions which can be provided through well log interpretation techniques. Another advantage of well log measurements is reflected on averaging longer reservoir intervals, minimizing the statistical fluctuation and allowing behavior trends to be recognized. Fig. 2 shows an integrated generalized flow chart for the process of discriminating the reservoir into different flow units utilizing core and well log data. For more information about characterization of hydraulic (flow) units, refer to references 3, 4, and 10.
The concept of RQI was introduced essentially for shale-free clastic reservoirs with interparticle porosity. It can be extended to formations with laminated shaly contents in general terms based on one or more permeability models. For example:
- Utilizing Coats and Deno Model.11
Coats and Deno permeability model can be written in terms of m, n, and BVWi, as:
![]() . .................................. (10)
. .................................. (10)
Substituting for Cn from Eq. 8 yields:
 . ....................... (11)
which can be used to calculate the permeability of formations with laminated shaly content. Then, RQI in this case takes the form of:
![]() . .................................... (12)
. .................................... (12)
where the Shale Zonation Indicator for formations with laminated shaly contents, SZIlam, is given by:
 . (13)
Eq. 12 indicates that a log-log plot of RQI vs. porosity for a flow unit with laminated shaly content should result in a straight line with a slope of (1.5m-0.5), as shown in Fig. 3. The intersection of this line with the 100% porosity line is a unique characteristic value for a particular flow unit, SZIlam. The shale zonation indicator incorporates most geological attributes of texture and shale mineralogy/distribution. It can be used in the delineation process between different hydraulic units with shaly content.
Fig. 3 shows that zones with practically similar SZIlam will form a recognized pattern with a trend that exhibits a unique slope of (1.5m-0.5). Zones forming that trend are practically expected to act as a single hydraulic unit with similar static and dynamic features. Zones with different SZIlam will follow parallel trends. The value of the cementation exponent, m, represents the degree of formation pore type departure from the common intergranular value of m=2 which will result in a slope of 2.5. For instance, as m decreases the fracture intensity in the formation increases. Furthermore, the cementation exponent, m, in the above equation may be replaced by the single textural paramter, w.
The features of log RQI vs. log j crossplot will vary depending on the models utilized to estimate K and for different shale distributions. This can be demonstrated in the following discussions.
b) Utilizing Coats-Dumanoir Model.12 Coats-Dumanoir permeability model can be written in terms of BVWi; as:
![]() . ................................................ (14)
. ................................................ (14)
Substituting for Cw from Eq. 8 when expressed in terms of the single textural parameter results in:
 . ................................ (15)
Eq. 15 can be used to calculate the permeability of formations with laminated shale in terms of w. Then, RQI in this case takes the form of:
![]() . ....................................... (16)
. ....................................... (16)
where:
 . .............. (17)
Eq. 16 indicates that a log-log plot of RQI vs. porosity for a flow unit with laminated shale should result in a straight line with slope of (2w-0.5). The intersection of this line with the 100% porosity line is a unique characteristic value for a particular flow unit, SZIlam. Fig. 4 shows that zones with practically similar SZIlam will exhibit a recognized pattern with a unique slope.
c) Utilizing Wyllie and Rose General Model.13
Similarly, Morris and Biggs version of Wyllie and Rose permeability model can be written in terms of BVWi as:
![]() . ............................................. (18)
. ............................................. (18)
Substituting for Cn from Eq. 8 yields:
 . ................................. (19)
Eq. 19 can be used to calculate the permeability of formations with laminated shaly contents. Then, RQI in this case takes the form of:
![]() . .......... (20)
. .......... (20)
where:
 . ............... (21)
Eq. 20 indicates that a log-log plot of RQI vs. j for a flow unit with laminated shaly content will result in a straight line with a slope of (2m-0.5) as shown in Fig. 5.
Characterization of Hydraulic Units with Dispersed Shaly Content
The characterization process follows the same steps as in the case of formations with laminated shaly contents. Several combinations can be generated between the various correlations available to estimate water saturation in formations with dispersed shaly content (e.g., Waxman-Smits, Juhasz, and Schlumberger) and the three permeability models used in this study (Coats-Deno, Coats-Dumanoir, and Wyllie-Rose).4
For example, Juhasz (1981)14 normalized Waxman-Smits correlation in terms of parameters that can be deriven from well log measurements. The correlation can be generalized in terms of cementation exponents, m, and for the case of n = 2.0 as:
 . ............. (22)
Eq. 22 can be written in a logarithmic format and expressed in terms of the irreducible bulk volume water concept to yield:
 . ....... (23)
where group AdisN is given by:
 . ................................. (24)
and
 . ................................ (25)
A log-log plot of j vs. (Rt/AdisN)irr will have the same features as in Fig. 1 except that zones at irreducible water saturation will exhibit a straight line with slope of 1/(2-m). A hydraulic unit with dispersed shaly content can be characterized by the resulting unique triangle EFG. In this case, the analysis will require a pre-estimate of aRw and m since they appear in both sides of Eq. 23. This makes the process of an iterative nature as explained by Aguilera (1990).7
The concept of RQI can be extended, now, to formations with dispersed shaly content. For example, utilizing Coats and Deno model given by Eq. 10 and applying Juhasz normalized correlation given by Eq. 22, the following expressions can be deriven as:
 . ....................... (26)
and
![]() . ....... (27)
. ....... (27)
where:
 . ................. (28)
Eqs. 26 and 27 can be used to determine the absolute permeability and characterize the RQI respectively for formations with dispersed shaly content. As indicated by Eq. 27, a log-log plot of RQI vs. j will result in a straight line with a slope of (1.5m-0.5) and a unique SZIdisN value (given by Eq. 28) for the hydraulic unit with dispersed shaly content, Fig. 6.
Characterization of Flow Units in Formations with Shaly Content (Total Model)
Several correlations are available to evaluate water saturation in formations with shaly content regardless of the shale distribution scenarios. These correlations are usually referred to as “Total Shale Models.” Simandoux correlation and the Dual Water concept will be applied here. The characterization process will follow the same steps as with the laminated shaly content case.
Applications of Simandoux Correlation
The total shale model of Simandoux (1963)15 can be generalized in terms of the cementation expoent, m, and for the case of n=2 as:
 . ....... (29)
The above equation may be written in the form:
![]() . .......... (30)
. .......... (30)
where Atsh is given by:
 . . (31)
and
![]() . ............................................... (32)
. ............................................... (32)
Again, the above equation, when plotted as a log-log crossplot of j versus (Rt/Atsh), will yield a straight line with a slope of -1/m. The BVWi concept is also applicable here. Similarly, the reservoir quality index can be developed based on any of the three selected permeability models. For example, utilizing Coats and Deno model:
![]() . ...................................... (33)
. ...................................... (33)
where:
 . .................... (34)
Application of the “Dual-Water” Concept
Inspired by the concept of shaly formation parallel conductance mechanism for free electrolyte and exchange cations, Clavier et al. (1984) capitalized on the idea of a dual-water model.16 Their model can be expressed in well log derived parameters and rewritten in terms of m and n=2.0 as:
![]() . ........................................... (35)
. ........................................... (35)
where:
 . (36)
and
 . ................................... (37)
Now, the same procedures can be applied, as with the previous models, to construct the log j versus log (Rt/AshD) crossplot. Again, the analysis requires a pre-estimate of aRw and m. This makes the process of an iterative nature which should result in refinement of the m value and double-check the formation water resistivity Rw.
Consequently, the reservoir quality index can be developed based on any of the three selected permeability models. For example, utilizing Coats and Deno model:
![]() . ...................................... (38)
. ...................................... (38)
where
 . ................... (39)
Furthermore, the method of characterizing hydraulic units in shaly formations can be radially extended to any of the many formulas used to calculate water saturation in shaly formation including Raiga-Clemenseau et al., Indonesian, Patchett and Rausch, Hossin, etc.
Characterization of Flow Units with Shaly Content Utilizing a New Permeability Model
Elkewidy (1996) developed a new model to calculate formation absolute permeability from well log data for formations with a transition zone.4 The model which is applicable to formations with shaly contents and/or different pore geometry other than interparticles is given by:
![]() . ...................................... (40)
. ...................................... (40)
where A is a characteristic constant for the hydraulic unit and is given by:
 . .............................. (41)
The Swi term in Eq. 40 may be replaced by irreducible water saturation derived from different clean and shaly models. Here, the reservoir quality index can be developed as follows:
(1) For a Shale-Free Formation (Using Archie’s Law)
![]() . .................................................. (42)
. .................................................. (42)
and
![]() . ......................................... (43)
. ......................................... (43)
where:
![]() . ............................................. (44)
. ............................................. (44)
![]() . ................................... (45)
. ................................... (45)
CZI is the clean formation zonation index.
(2) For Formations With Laminated Shaly Content (Using Poupon Correlation)
![]() . .................................................. (46)
. .................................................. (46)
and
![]() . ...................................... (47)
. ...................................... (47)
where:
 . .................... (48)
![]() . ................................. (49)
. ................................. (49)
SZIlam is the zonation index for formations with laminated shaly content.
(3) For Formations With Dispersed Shaly Content (Using Juhasz Normalized Waxman-Smits Correlation)
![]() . .................................................. (50)
. .................................................. (50)
and
![]() . ...................................... (51)
. ...................................... (51)
where:
 . ........... (52)
![]() . ..................................... (53)
. ..................................... (53)
SZIdis is the zonation index for formations with dispersed shaly content.
When CZI, SZIlam, and SZIdis are determined from core data, well logs, and/or previous experience with the area, then, the clean formations and the shale type (laminated or dispersed) of clay-contaminated reservoirs may be identified in uncored intervals and wells by constructing a log RQI vs. log j crossplot. As indicated by Eq. 43, the slope of the straight line for a clean flow unit equals (0.25m-0.5), whereas the slope of the straight line in the case of a hydraulic unit with laminated shaly content equals (1.25m-0.5), Eq. 47. Furthermore, in the case of dispensed shaly contaminants, Eq. 51, the slope equals (2.25m-0.5). The intersection of the straight lines with j=1.0 reflects the unique values of SZI. Cementation exponent, m, can be determined from crossplotting log j vs. log (Rt/Ash) as discussed earlier. Table 1 summarizes the above observations.
Application Example
Ideally, a log-log plot of RQI vs. porosity should show that zones with practically similar SZI forming a recognized pattern with a trend that exhibits a unique slope reflecting their cementation exponent, m. Zones forming that trend are practically expected to act as a single hydraulic unit with similar static and dynamic features. Zones with different SZI should exhibit parallel trends indicating the presence of other hydraulic units. A relatively large number of data points are needed to recognize those patterns.
A field example from the Taylor Formation, Big Foot, Texas, is used here to demonstrate the applicability of the new technique discussed in the previous sections. This Taylor sand formation is known to contain a high amount of dispersed shaly contents. The lithology has been described as very shaly, very fine grained to silty consolidated quartz sand. Liquid (brine) permeabilities were available which should correlate well with other petrophysical parameters.17 Fig. 7 illustrates a crossplot of log RQI vs. j for this formation. Not enough data were available to clearly recognize distinct patterns. However, five hydraulic units may be distinguished from the plot each with a unique SZI value as indicated. The straight lines have a slope value of 3.1 which corresponds to a cementation exponent m=2.4. As expected, this relatively high m value (m>2) reflects the increasing tortuosity of the Taylor Formation due to its high shaly contents. A more accurate value of m could have been determined from crossplotting log j vs. log Rt if well log data were available. Further application of the proposed technique is required.
Conclusions
1. A new comprehensive approach has been developed to characterize hydraulic (flow and no flow) units in reservoirs with laminated, dispersed, or general shaly contents.
2. The concept of Reservoir Quality Index, RQI, and its attributes has been extended to formations with shaly contents.
3. The proposed graphical solution is applicable to shaly clastic and carbonate reservoirs including those with natural fractures. It can be used to delineate each hydraulic unit with its petrophysical properties and unique Shale Zonation Index, SZI.
Nomenclature
a = constant
BVWi = irreducible bulk volume water
C = constant
CZI = clean formation zonation index
F = formation resistivity factor
FII = fracture intensity index
Fs = effective pore throat shape factor
K = average permeability
m = cementation exponent
n = saturation exponent
Rlam = resistivity of the laminated shale
Ro = resistivity of 100% water saturated formation
RQI = reservoir quality index
Rsh = shale resistivity
Rt = true formation resistivity
Rti = true resistivity of the formation at irreducible water saturation
Rw = formation water resistivity
Rwb = bound water resistivity
Sgv = specific surface area per unit grain volume
Sw = water saturation
Swb = bound water saturation
Swi = irreducible water saturation
Swt = total water saturation
V = fracture partitioning coefficient
Vdis = dispersed shale volume fraction
Vlam = laminated shale volume fraction
Vsh = shale volume fraction
w = single textural parameter
Ze = effective zoning factor
g = fraction of the pore space that is water wet
jdis = dispersed shale porosity
je = effective porosity, same as j
jf = fracture porosity
jlog = log derived porosity
jsh = shale porosity
jt = total porosity
ro = hydrocarbon density
rw = water density
s = interfacial tension
t = tortuosity
q = contact angle
ω = storativity ratio
Subscripts
lam = laminated
dis = dispersed
tsh = total shale
irr = irreducible
DU = Dual-water
References
- Almon, V.E.: “A Geologic Appreciation of Shaly Sands,” C.W.L.S. 7th Formation Symposium, paper K, Oct. 21-24, 1979.
- Wilson, M.D.: “Origins of Clays Controlling Permeability in Tight Gas Sands,” JPT, Dec. 1982, p. 2871-2876.
- Amaefule, J.O., Altunbay, M., Tiab, D., Kersy, D. and Keelan, D.: “Enhanced Reservoir Description: Using Core and Log Data to Identify Hydraulic (Flow) Units and Predict Permeability in Uncored Intervals/Wells,” paper SPE 26436, 1993.
- Elkewidy, Tarek Ibrahim: Characterization of Hydraulic (Flow) Units in Heterogeneous Clastic and Carbonate Reservoirs, 2012.
- Fertl, W.H.: “Log-Derived Evaluation of Shaly Clastic Reservoirs,” JPT, v. 39, 1987, p. 175-194.
- Worthington, P.F.: “The Evolution of Shaly-Sand Concepts in Reservoir Evaluation,” The Log Analyst, v. 26, 1985,p. 23-40.
- Aguilera, R.: “Extensions of Pickett Plots for the Analysis of Shaly Formations by Well Logs,” The Log Analyst, Sept.-Oct. 1990.
- Bassiouni, Z.: Theory, Measurement, and Interpretation of Well Logs; SPE Textbook Series Vol. 4, Richard, 1994.
- Doveton, J.H., Guy, W., Watneg, W.L., Bohling, G.C., Sait, U., and Heljeson, D.A.: “Log Analysis of Petrofacies and Flow-Units with Microcomputer Spreadsheet Software,” Kansas Geological Survey, Lawrence, 1995.
- Tiab, D.: Modern Core Analysis, Vol. 1 Theory, Core Laboratories, Houston, Texas, 1993.
- Coats, G.R., Deno, S.: “The Permeability Answer Product,” The Technical Review, 29, no. 2, June 1981, p. 55-63.
- Coats, G.R., Dumanoir, J.L.: “A New Approach to Improved Log Derived Permeability,” Trans. SPWLA, 1973.
- Wyllie, M.R.J. and Rose, W.D.: “Some Theoretical Considerations Related to the Quantitative Evaluation of the Physical Characteristics of Reservoir Rock from Electrical Log Data,” Trans. AIME, 189, 1950, p. 105-118.
- Juhaz, I.: “Normalized Qv - The Key to Shaly Sand Evaluation Using the Waxman-Smits Equation in the Absence of Core Data,” SPWLA Symposium, paper 1, 1981.
- Simandox, P.: “Measures Dièlectrique en milieu poreus, application á mesure de saturation en eau, ètude des massifs argileaux,” Revue e l’Inst. Français de Pétrole, Supplement issue, 1963, p. 193-215.
- Clavier, C., Coates, G.R., Dumanoir, J.L.: “Theoretical and Experimental Bases for the Dual-Water Model for the Interpretation of Shaly Sand,” SPEJ, April 1984, p. 153-168.
- Waxman, M.L., Smiths, L.J.M.: “Electrical Conductivities in Oil-Bearing Shaly Sands,” SPEJ, June 1968, p. 107-122, Trans. AIME, 24.
TABLE 1-HYDRAULIC UNIT CHARACTERIZATION USING THE NEW K-j MODEL |
||
HYDRAULIC UNIT |
SLOPE |
ZONATION INDICATOR |
clean |
0.25m - 0.5 |
|
laminated or structural shaly content |
1.25m - 0.5 |
|
dispersed shaly content |
2.25m - 0.5 |
|
|
||


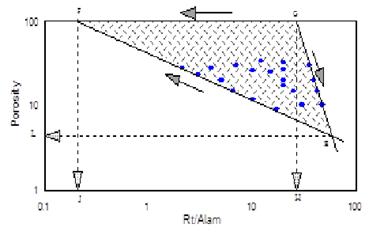
Fig. 1 - The concept of crossplotting log j vs. log Rt for formations with laminated shale.
Fig. 2 - A Generalized Flow Chart for Characterizing Flow Units Using Core and Well Log Data (Modified after Amaefule et al., 1993)
Fig. 3 - RQI-Formations with Laminated Shale Utilizing Coats and Deno Model (m)
Fig. 4 - RQI-Formations with Laminated Shale Utilizing Coats-Dumanoir Model (w)

Fig. 5 - RQI-Formations with Laminated Shale Utilizing Wyllie and Rose Model (m)

Fig. 6 - RQI-Formations with Dispersed Shale Utilizing Coats and Deno Model (m)
AAPG Search and Discovery Article #90166©2013 AAPG International Conference & Exhibition, Cartagena, Colombia, 8-11 September 2013