Experiences with AIRGrav in Polar Exploration and Research
Stefan Elieff1, Joël Dubé
Sander Geophysics, Ottawa, ON, Canada
Introduction
Sander Geophysics' AIRGrav airborne gravity systems have been flying commercial surveys for over 10 years. In recent years they have seen increased use in polar regions for exploration projects and for research studies. While the exploration projects are similar to surveys conducted at lower latitudes, albeit under more extreme conditions, the polar research projects have presented a number of unusual challenges. Four cases covering exploration and research projects are described.
Case 1: Off-shore Petroleum Exploration
A large magnetic and gravity survey for a petroleum industry client was flown off the coast of Western Greenland in Baffin Bay. Completed in 2009, over 50,000 lkm of data was acquired at 900 m by 7200 m line spacing using two fixed wing aircraft flying at 100 knots. Since the survey was entirely off shore a constant flying height of 150 m above sea level was used. This makes it similar in this respect to surveys that use different gravity instruments incapable of collecting data while climbing or descending to follow terrain. An analysis of the gravity grids indicates an accuracy level of just under 0.5 mGal standard deviation at 2.5 km resolution.
Figure 1 shows the gravity data for the entire survey block. Figure 2 shows a zoomed view comparing the gravity and magnetic data with a geological map. This survey was flown because combined magnetic and gravity data are useful tools for better understanding the regional geology of an area. They are especially helpful in defining geological structures, estimating basins depth and extent, and identifying intrusions or volcanic rock occurrences. Used in conjunction with seismic interpretation, they enable the extrapolation of such results, effectively helping to define the lateral trends and extents of interpreted structures.
Difficulties with Arctic low cloud and fog hampered data acquisition throughout this survey. While poor weather is not unique to polar surveys, it was compounded by the darkness of the polar winter. It was not possible to continue flying through the winter after lengthy weather delays slowed production in the spring, summer, and fall since survey operations are limited to daytime VFR conditions for safety reasons. The field crew was forced to demobilize for the winter twice before the survey could be completed in the third year. At more southerly latitudes with winter daylight, it may have been possible to continue flights through the winter.
Case 2: Helicopter in rugged terrain
The second survey was flown as part of a government mapping project in an area along the Mackenzie river valley in the vicinity of Norman Wells, NWT, Canada (Dumont, 2009). The survey was commissioned in 2008 by the Northwest Territories Geoscience Office because publicly available gravity data was considered relatively low resolution in this region with proven petroleum resources. It was deemed that enhanced data would support further petroleum exploration in the area. Airborne gravity data at 2000 m by 10,000 m line spacing totalling approximately 8000 lkm was acquired in 24 days using a helicopter flying at 85 knots. Minimum terrain clearance was 150 m as in the offshore petroleum survey, but in the case of the Northwest Territories survey there were significant topographical features ranging over 1500 m in elevation. A draped flying surface with maximum climb and descent rates of 50 m/km was used to keep the aircraft near the ground throughout the survey area, as shown in Figure 3.
The ability to maintain close proximity to the terrain by flying drape has several benefits. Higher altitudes necessary when flying at a constant height, and the resulting loss in resolution due to attenuation of the gravity and magnetic signal, are avoided. Some instruments, such as spectrometers and laser scanners, are range limited and unable to acquire any usable data beyond a certain altitude above the surface. Maximizing the amount of usable data collected takes on greater importance in a difficult environment where there may be a limited time window for aircraft operations, as is often the case in polar surveys.
The final gravity grids in the Mackenzie Valley survey had a slightly lower accuracy of approximately 0.6 mGal standard deviation using the same 2.5 km half-wavelength filter than the off-shore petroleum survey described in Case 1, largely attributable to the wider line spacing in the design of the survey. Despite flying the drape necessary to maintain close proximity to the ground, there was no loss of accuracy in the gravity data caused by the increased dynamics of the flight environment.
A digital elevation model and the free air gravity from the airborne survey are shown in Figure 4. The free air
gravity is strongly influenced by the rugged topography of the survey area. Significant differences with the
![]() Bouguer
Bouguer![]() gravity (at right in Figure 5 below) highlight the importance of a proper
gravity (at right in Figure 5 below) highlight the importance of a proper ![]() Bouguer
Bouguer![]() /terrain
/terrain ![]() correction
correction![]() for
obtaining geologically meaningful gravity data. Figure 5 shows a comparison between the existing regional
for
obtaining geologically meaningful gravity data. Figure 5 shows a comparison between the existing regional
![]() Bouguer
Bouguer![]() gravity and the
gravity and the ![]() Bouguer
Bouguer![]() gravity from the airborne survey. As can be seen, the project achieved the
objective of significantly improving the gravity resolution.
gravity from the airborne survey. As can be seen, the project achieved the
objective of significantly improving the gravity resolution.
Case 3: Polar research projects - AGAP
Compared with the older generation of airborne gravity instruments traditionally used in polar research projects, modern instruments such as AIRGrav that have been developed for the exploration industry have significant advantages. In particular, the system's tolerance of aircraft motion (translating into shorter lead-ins to lines and enabling data acquisition during turbulent conditions and aggressive drape flying as was used in the Northwest Territories survey) sparked interest from Lamont Doherty Earth Observatory (LDEO) of Columbia University for using AIRGrav as part of a large multinational International Polar Year research project. The AGAP (Antarctica's Gamburtsev Province) project was designed to map the ice sheet, the Gamburtsev Mountains buried beneath the ice sheet, and identify subglacial lakes using ice penetrating radar, magnetic, laser scanner, and gravity data acquired from a Twin Otter in the centre of the Antarctic continent.
The enhanced resolution, accuracy, and efficiency of modern commercial gravity instruments developed for the exploration industry prompted LDEO to conduct a side-by-side comparison test of the AIRGrav system and a Canadian Micro Gravity GT-1A gravity meter over the Rocky Mountains near Calgary and over the North Pole in 2007 for suitability in polar research. The higher resolution and accuracy of the AIRGrav system, coupled with shorter line lead-ins and a demonstrated ability to acquire data in a wider range of conditions led to its selection for use in Antarctica (Studinger, 2008).
Following a series of flights over the Greenland ice sheet in 2008, AIRGrav was deployed to Antarctica for the 2008-2009 field campaign. The field camp established as a base of operations for the United States led portion of the expedition, named AGAP-South, was located in the remote heart of East Antarctica. Despite being the middle of the Antarctic summer, temperatures hovered in the -25ºC to -35ºC range (before wind chill). The tremendous thickness of the ice sheet meant AGAP-South was at an altitude of 3500m (11,500'). Logistical challenges with fuel resupply and camp installation, plus weather and a short flying 'season' of temperatures above the -50ºC limit for aircraft operations meant it was essential to capitalize on every flying opportunity.
Survey flights took place between 22nd December 2008 and 17th January 2009, with a total of 53 flights and 55,000 line km of data acquired. When weather allowed, around the clock flying made full use of the 24 hour daylight. During the most productive 6 day period of good weather, 21 flights were performed that represented 40% of the entire survey. The Twin Otter conducted 4 flights per day, spending 22 hours airborne, and covering over 4000 km each day. Throughout this intensive period of flying, and through the entire survey, the AIRGrav system collected high quality data with a zero failure rate.
A second Twin Otter operated by the British Antarctic Survey for AGAP also successfully collected gravity data in an adjacent region using a traditional Lacoste & Romberg gravity meter modified by ZLS, with the differences noted in the following table (Jordan 2009).
Case 4: Polar research projects - IceBridge
The success at AGAP has led to ongoing work with LDEO providing gravity data for NASA's project IceBridge, a multi-year campaign to monitor the ice at the Earth's poles primarily using NASA's large DC8 and P3B aircraft science platforms. Round trip flights are performed from the operating base in Punta Arenas, Chile, over Antarctica during the Southern hemisphere spring, and from Thule and Kangerlussuaq in Greenland over the Greenland ice sheet, Canadian glaciers, and Arctic sea ice during the Northern hemisphere spring. Arctic flights from 2010 are shown in Figure 6. As in AGAP, the IceBridge aircraft carry laser scanners to map the ice surface and ice penetrating radars to image within the ice down to the base of the ice beneath. The primary role of the gravity data over ice sheets is to derive bathymetry beneath floating ice shelves that cannot be seen by radar.
On flights over sea ice, the gravity data is acquired to better define the local geoid to help determine sea level when there are no open leads of water between ice flows. This project also presents an opportunity to apply new techniques being developed for extracting horizontal gravity components measured directly by the AIRGrav system.
IceBridge flights have expanded the envelope of AIRGrav operating environments. Flight durations are up to 12.5 hours and 9000 km. Baselines for differential GPS processing have exceeded 4000 km. Flight altitudes range from 150 m-12,000 m (500'-40,000') with speeds between 270-450 knots (140-230 m/s).
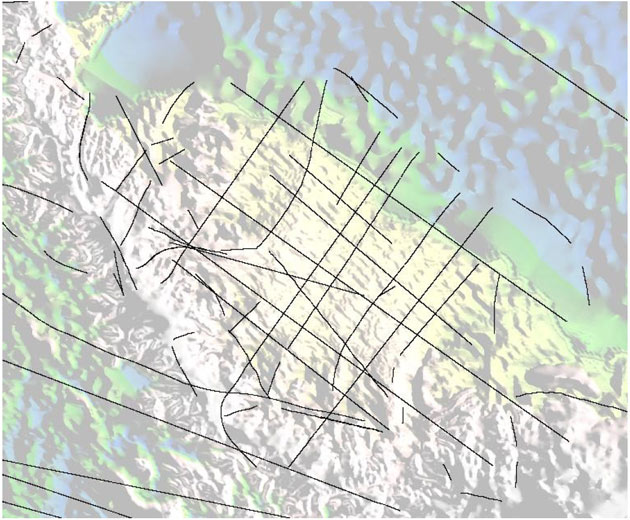
One of the most difficult challenges is a flight environment that is often optimized to meet the needs of other science instruments. Some lines are planned with gravity data given highest priority. Put simply, this means the lines are flown straight. Often, however, laser scanner data is the highest priority. Laser scanner data has previously been acquired along narrow swaths of the ice sheet. These swaths must be re-flown precisely in subsequent years to obtain a laser data time series that can be used to track changes in the ice sheet. The aircraft is constantly manoeuvring during these lines, which can follow zig-zag paths up and down the flow lines of glaciers and across ice shelves (Figure 7). The impact on AIRGrav data varies from minimal effect to roughly a doubling of noise levels or an equivalent loss of resolution by employing stronger filters to maintain accuracy. It is important to bear in mind that other gravity instruments would be unlikely to recover any usable data in these circumstances, let alone data at a resolution and accuracy level that stands up well against traditional airborne gravity instruments flown under ideal conditions and which is being used for scientific interpretation.
The presence of other high-priority science instruments and objectives coupled with limited flight hours and frequent poor weather around the poles also means that no re-flights are possible, nor are significant flight delays. Similar to AGAP, the gravity system must be ready and available to fly whenever required. In the period covering AGAP Twin Otter flights in Antarctica (2008-2009), two IceBridge deployments over Antarctica with the DC8 (2009-2010), and two over the Arctic with the DC8 and P3 (2010-2011), 155 survey flights have been performed. Of those, there was only one flight with lost gravity data due to an in-flight acquisition computer failure, which translates into a better than 99% success rate. IceBridge flights with the AIRGrav instrument on board will continue through 2011.
Selected References
Dumont, R., 2009. Geophysical series, NTS 96 E, 106 H and parts of 96 C, 96 D , 96 F, and 106 A, Norman Wells, Northwest Territories; Geological Survey of Canada, Open File 6154; Northwest Territories Geoscience Office, Open File 2009-01; scale 1:250 000.
Comparison of AIRGrav and GT-1A airborne gravimeter for research applications. Geophysics, Vol.73, No.6 (November-December) 2008. Studinger, M; Bell, R.; Frearson, N.
Investigating subglacial landscapes and crustal structure of the Gamburtsev Province in East Antarctica with the aid of new airborne gravity data. American Geophysical Union, Fall Meeting 2009, abstract #C43A-0484 Jordan, T. A.; Ferraccioli, F.; Studinger, M.; Bell, R. E.; Damaske, D.; Elieff, S.; Finn, C.; Braaten, D. A.; Corr, H.
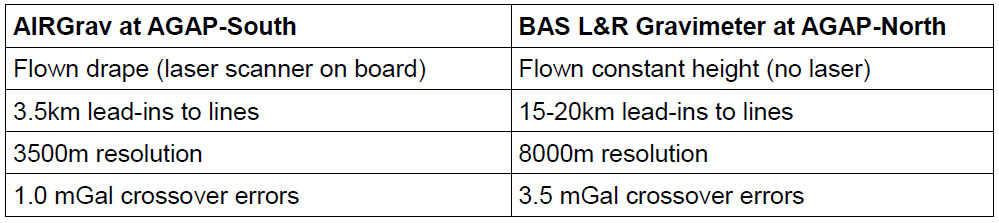
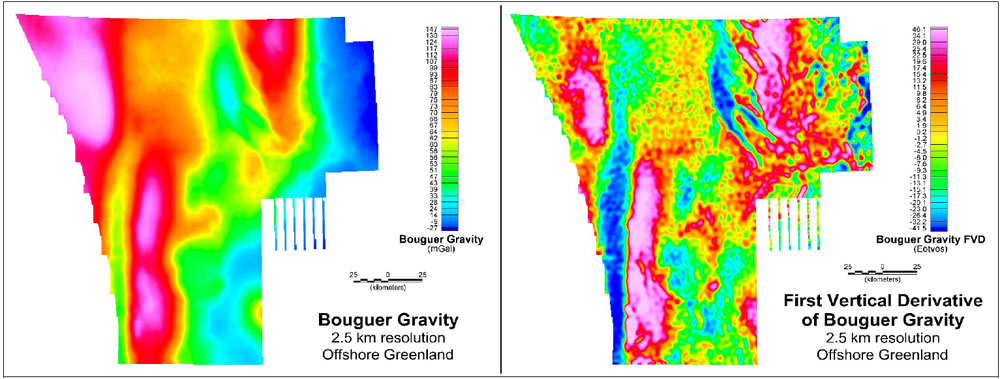 Figure 1: Offshore petroleum survey
 ![]() Bouguer
Bouguer![]() gravity and its first vertical derivative.
gravity and its first vertical derivative.
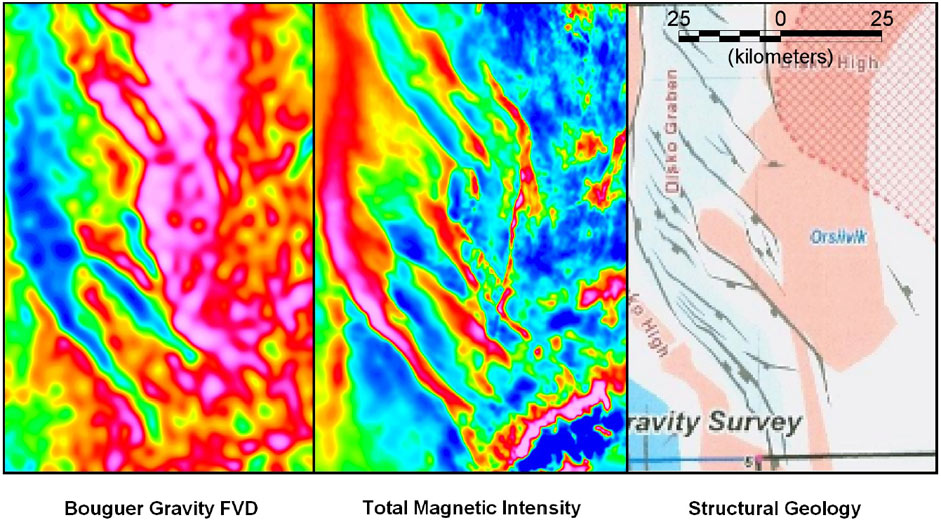 Figure 2: Zoomed view of gravity and magnetic data with structural geology.
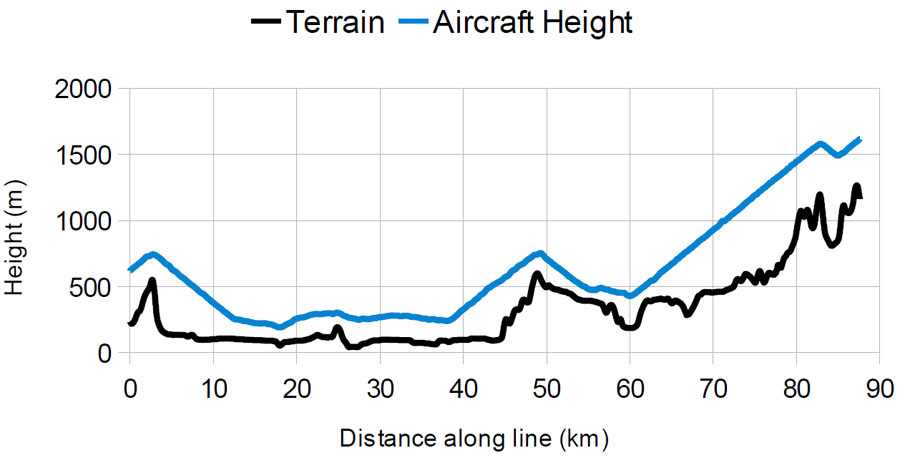
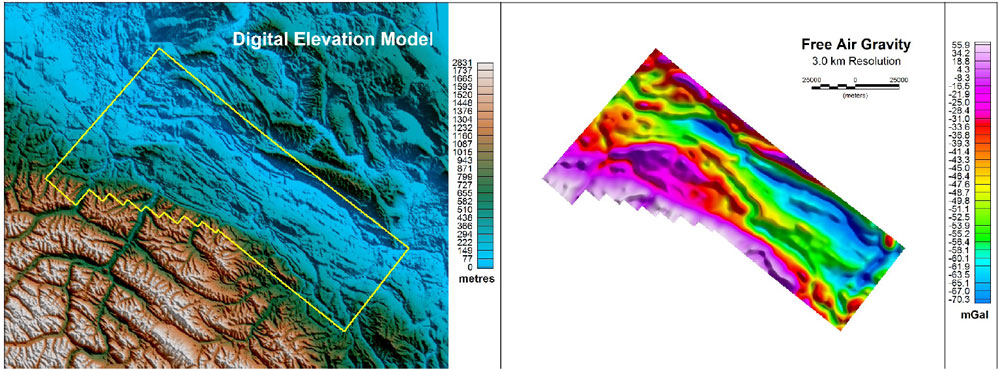 Figure 4: Digital elevation model with survey block outline (left) and the free air gravity (right).
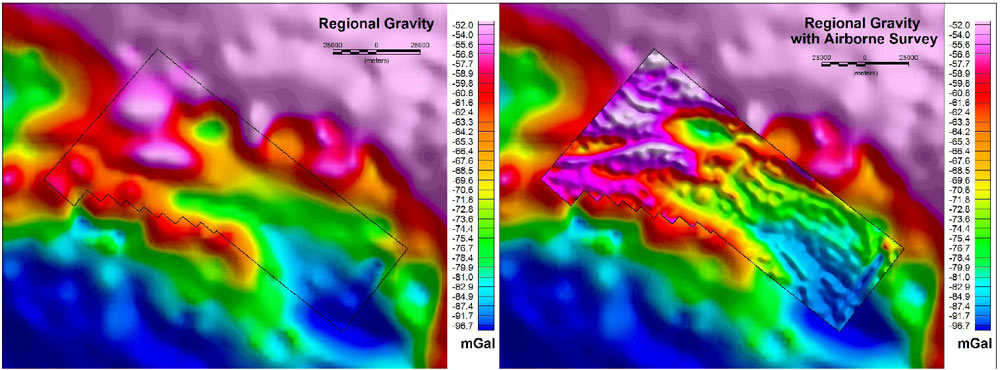 Figure 5: Comparison of existing regional low resolution
 ![]() Bouguer
Bouguer![]() gravity (left) and high resolution provided by the airborne survey (right).
gravity (left) and high resolution provided by the airborne survey (right).
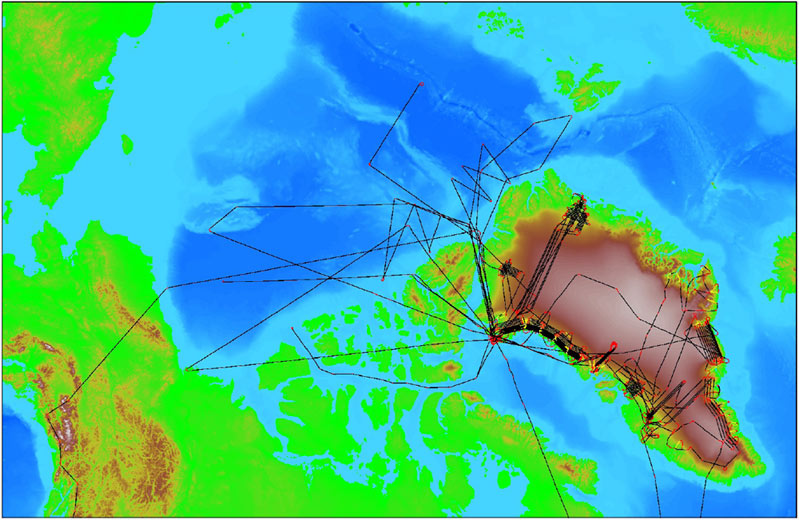 Figure 6: NASA IceBridge flights with AIRGrav in the Arctic during 2010.
AAPG Search and Discovery Article #90130©2011 3P Arctic, The Polar Petroleum Potential Conference & Exhibition, Halifax, Nova Scotia, Canada, 30 August-2 September, 2011.