AAPG GEO 2010 Middle East
Geoscience Conference & Exhibition
Innovative Geoscience Solutions – Meeting Hydrocarbon Demand in Changing Times
March 7-10, 2010 – Manama, Bahrain
Sequence Stratigraphy and Reservoir Characterisation of Barren Fluvial Sequences Using Rock-Typing Analyses of Core and ![]() Cuttings
Cuttings![]()
(1) SGS, The Hague, Netherlands.
(2) Delft University of Technology, Delft, Netherlands.
(3) ARQS Team, SGS UK, Ellesmere Port, United Kingdom.
(4) ARQS Team, SGS Canada, Lakefield, ON, Canada.
Introduction
Accurate reservoir modelling relies primarily on the type, quality and amount of subsurface available data. Despite recent improvements in the resolution and reliability of data acquisition and interpretation tools, both using seismic and sophisticated wire line logging techniques, real direct reservoir observation is still represented primarily by cores or sidewall cores. Because of the operational complications and high costs associated with this type of data acquisition, cores or side-wall cores are typically limited to either a portion of the reservoir section, or to a small number of wells in a given area. These constraints inevitably raise questions as to how representative the core data are, especially when used to describe complex reservoirs characterised by lateral and vertical heterogeneity in facies, geometry and properties.
The other direct type of subsurface data which are typically extracted “freely” ![]() from
from![]() the entire reservoir sections are drill
the entire reservoir sections are drill ![]() cuttings
cuttings![]() . Depending on drilling techniques (rate of penetration, drilling fluid circulation, etc),
. Depending on drilling techniques (rate of penetration, drilling fluid circulation, etc), ![]() cuttings
cuttings![]() can be collected at high-frequency intervals, providing a good vertical coverage and representation of the rock interval of interest. They are extracted
can be collected at high-frequency intervals, providing a good vertical coverage and representation of the rock interval of interest. They are extracted ![]() from
from![]() each well and are therefore aerially and vertically more statistically meaningful when compared with sparse and incomplete core data.
each well and are therefore aerially and vertically more statistically meaningful when compared with sparse and incomplete core data.
For this reason, the detailed study of ![]() cuttings
cuttings![]() and the ability to describe and quantify their composition, texture and reservoir properties (rock-typing) represents a very useful approach which can assist in reducing reservoir uncertainties associated with stratigraphical subdivision, flow unit identification and reservoir property description. This paper presents the results of a study made on a well known heterogeneous clastic reservoir and demonstrates the value of high-resolution analysis of core and
and the ability to describe and quantify their composition, texture and reservoir properties (rock-typing) represents a very useful approach which can assist in reducing reservoir uncertainties associated with stratigraphical subdivision, flow unit identification and reservoir property description. This paper presents the results of a study made on a well known heterogeneous clastic reservoir and demonstrates the value of high-resolution analysis of core and ![]() cuttings
cuttings![]() material. Automated mineralogical and textural analysis using ARQ (Advanced Reservoir Quality) technology has proven to be a fast, reliable and cost effective technique for rock-typing and reservoir characterisation.
material. Automated mineralogical and textural analysis using ARQ (Advanced Reservoir Quality) technology has proven to be a fast, reliable and cost effective technique for rock-typing and reservoir characterisation.
The Case Study
The main reservoirs of the Schooner gas field in the UK Southern North Sea occur in the Westphalian C/D Barren Red Measures. This reservoir is characterised by low net-to-gross barren fluvial sequences with isolated channel sand bodies and laterally variable log signature. The sedimentary succession comprises low-sinuosity fluvial channel-fill sandstones with associated lacustrine and pedoturbated overbank/flood plain mudstones.
As a consequence of poor production performance of this field, a review of the reservoir geology and stratigraphy was conducted in order to update the 3D understanding of the subsurface (Stone and Moscariello, 1999). A detailed review of sedimentary facies ![]() from
from![]() cores along with chemostratigraphical analysis of
cores along with chemostratigraphical analysis of ![]() cuttings
cuttings![]() was undertaken and resulted in new stratigraphical subdivisions and new geological and dynamic models which ultimately led to better prediction capability of fluid-flow performance (Moscariello, 2003; Pearce et al, 2005).
was undertaken and resulted in new stratigraphical subdivisions and new geological and dynamic models which ultimately led to better prediction capability of fluid-flow performance (Moscariello, 2003; Pearce et al, 2005).
Based on these encouraging results, the Schooner field was selected as a test case for applying ARQ technology to obtain mineralogical and geochemical data for the purposes of measuring bulk mineralogy, lithology, primary depositional textures, diagenetic overprint and porosity typing. These data were obtained in order to evaluate the potential of using ARQS as a complementary, or an alternative, approach to more common techniques (e.g. core analysis, petrographic and petrophysical studies) in the support of both stratigraphical correlation and reservoir characterisation.
Rock-typing Method
Over 200 samples ![]() from
from![]() both core and
both core and ![]() cuttings
cuttings![]() were taken
were taken ![]() from
from![]() wells 44/26-2 and 44/26-3 and analysed at SGS’s ARQS laboratories (Vancouver and Lakefield, Canada). Analysis was undertaken primarily using QEMSCAN® technology but other complementary techniques such as X-ray diffraction (XRD), scanning electron microscope (SEM) and electron probe micro-analyser (EPMA) were integrated as required.
wells 44/26-2 and 44/26-3 and analysed at SGS’s ARQS laboratories (Vancouver and Lakefield, Canada). Analysis was undertaken primarily using QEMSCAN® technology but other complementary techniques such as X-ray diffraction (XRD), scanning electron microscope (SEM) and electron probe micro-analyser (EPMA) were integrated as required.
The QEMSCAN® system is an automated instrument comprising an electron-beam platform fitted with up to four energy dispersive X-ray spectrometers that rapidly mineralogically maps a variety of sample types (e.g. core, ![]() cuttings
cuttings![]() , and loose sand grains). The technique provides rapid, statistically reliable, repeatable mineralogical and compositional data
, and loose sand grains). The technique provides rapid, statistically reliable, repeatable mineralogical and compositional data ![]() from
from![]() any chemically distinct inorganic sample. The system mineralogically ‘images’ a polished section through the sample so that mineralogical textures are preserved. Each analysis typically comprises well in excess of 500,000 individual mineralogical determinations and therefore measurements are reproducible, robust and operator independent. In addition to the mineralogical images, routine data outputs include bulk and lithotype specific mineralogy, mineral grain size, lithotype abundance, calculated grain density, calculated chemistry and for core samples, macro-porosity.
any chemically distinct inorganic sample. The system mineralogically ‘images’ a polished section through the sample so that mineralogical textures are preserved. Each analysis typically comprises well in excess of 500,000 individual mineralogical determinations and therefore measurements are reproducible, robust and operator independent. In addition to the mineralogical images, routine data outputs include bulk and lithotype specific mineralogy, mineral grain size, lithotype abundance, calculated grain density, calculated chemistry and for core samples, macro-porosity.
In the case of ![]() cuttings
cuttings![]() samples, individual
samples, individual ![]() cuttings
cuttings![]() grains can be extracted
grains can be extracted ![]() from
from![]() the mineralogical image and can be classified (lithotyped) into populations of particles on the basis of their mineralogy and texture. For each lithotype (or if required, each particle) lithological and mineralogical attributes can be extracted; in this way, mineralogical, lithological and textural variations can be traced and quantified down-hole. Similarly, drilling contaminants / additives can be classified and selectively removed
the mineralogical image and can be classified (lithotyped) into populations of particles on the basis of their mineralogy and texture. For each lithotype (or if required, each particle) lithological and mineralogical attributes can be extracted; in this way, mineralogical, lithological and textural variations can be traced and quantified down-hole. Similarly, drilling contaminants / additives can be classified and selectively removed ![]() from
from![]() the dataset. The raw data can be imported into various geological software packages for statistical analyses, display, correlation or 3D static model building purposes.
the dataset. The raw data can be imported into various geological software packages for statistical analyses, display, correlation or 3D static model building purposes.
Results
Bulk Mineralogy:
Bulk mineralogical data for both core and ![]() cuttings
cuttings![]() were plotted against wireline data. The resultant data demonstrate downhole variation in detrital and authigenic mineralogy in both core and
were plotted against wireline data. The resultant data demonstrate downhole variation in detrital and authigenic mineralogy in both core and ![]() cuttings
cuttings![]() samples. This allows the identification of stratigraphical units associated with changes in sediment composition both in channel-fill and flood plain dominated intervals.
samples. This allows the identification of stratigraphical units associated with changes in sediment composition both in channel-fill and flood plain dominated intervals.
In all cases coarse flakes of mica, steel and barium-based drilling mud (Ba- Ca- Silica mud and barite) contamination were recognised and selectively removed ![]() from
from![]() the dataset.
the dataset.
Geochemistry:
At each of the >500,000 analysis points within a single measurement, a density and an ideal or measured chemical composition are assigned. In this way, calculated geochemical profiles can be derived ![]() from
from![]() QEMSCAN® data. Typically, only major and minor elements (> 1 wt %) are assigned to each mineral determination and therefore the data are qualitative to semi-quantitative but owing to the large number of analyses in each measurement, the chemical data are precise and consistent throughout the dataset. Furthermore, the chemical data can be derived for the whole sample, specific lithotypes or even specific particles if required.
QEMSCAN® data. Typically, only major and minor elements (> 1 wt %) are assigned to each mineral determination and therefore the data are qualitative to semi-quantitative but owing to the large number of analyses in each measurement, the chemical data are precise and consistent throughout the dataset. Furthermore, the chemical data can be derived for the whole sample, specific lithotypes or even specific particles if required.
In this study, data solely derived ![]() from
from![]() the mudstone lithotypes were extracted in addition to the bulk (whole rock) data to provide downhole geochemical profiles. Vertical variation of diagnostic geochemical elements such as TiO2, Zr, and their ratios such as Ti/Zr, Th/Zr and P2O5/Zr allowed the identification of distinct stratigraphical zones comparable to those obtained
the mudstone lithotypes were extracted in addition to the bulk (whole rock) data to provide downhole geochemical profiles. Vertical variation of diagnostic geochemical elements such as TiO2, Zr, and their ratios such as Ti/Zr, Th/Zr and P2O5/Zr allowed the identification of distinct stratigraphical zones comparable to those obtained ![]() from
from![]() chemostratigraphical analysis (Stone & Moscariello, 1999; Moscariello, 2003). This new stratigraphical subdivision formed the solid basis of a new sequence stratigraphical framework and related 3D architecture which proved to be more consistent with both the regional geological setting and, more importantly, with dynamic field behaviour (Pearce et al., 2005).
chemostratigraphical analysis (Stone & Moscariello, 1999; Moscariello, 2003). This new stratigraphical subdivision formed the solid basis of a new sequence stratigraphical framework and related 3D architecture which proved to be more consistent with both the regional geological setting and, more importantly, with dynamic field behaviour (Pearce et al., 2005).
Textural Analysis:
One of the strengths of ARQ analysis over other bulk mineralogical and geochemical methods (e.g. XRD, XRF analyses) is that it is not destructive or invasive and thus preserves original textural information.
Both in-channel and out-of-channel environments have been sampled in both type wells using the core samples to constrain the ![]() cuttings
cuttings![]() samples. Selected mineralogical images of core piece samples with a diverse range of micro-sedimentary textures were analysed in terms of grain-size, packing, pore-infill minerals and pore type, shape and connectivity.
samples. Selected mineralogical images of core piece samples with a diverse range of micro-sedimentary textures were analysed in terms of grain-size, packing, pore-infill minerals and pore type, shape and connectivity.
Four representative samples were analysed resulting in the following observations (Fig 2):
Sample A: poorly to moderately sorted, laminated fluvial ![]() sandstone
sandstone![]() dominated by detrital quartz grains. Cement phases include grain replacive and pore filling kaolinite and poikilotopic anhydrite and dolomite which locally occlude both primary and secondary porosity. The presence of a minor authigenic phase of euhedral quartz (eq) was also observed.
dominated by detrital quartz grains. Cement phases include grain replacive and pore filling kaolinite and poikilotopic anhydrite and dolomite which locally occlude both primary and secondary porosity. The presence of a minor authigenic phase of euhedral quartz (eq) was also observed.
Sample B: moderately to well sorted, bimodal, laminated fluvial ![]() sandstone
sandstone![]() . The detrital mineral assemblage is dominated by quartz with lesser compacted and redistributed mudstone intraclasts. The finer grained laminae demonstrate concentrations of heavy minerals including rutile, chromite, ilmenite and zircon. Inherited quartz (iq) overgrowths are noted along with an authigenic phase of euhedral quartz (eq). Poikilotopic siderite, variably ferroan dolomite and kaolinite are also observed
. The detrital mineral assemblage is dominated by quartz with lesser compacted and redistributed mudstone intraclasts. The finer grained laminae demonstrate concentrations of heavy minerals including rutile, chromite, ilmenite and zircon. Inherited quartz (iq) overgrowths are noted along with an authigenic phase of euhedral quartz (eq). Poikilotopic siderite, variably ferroan dolomite and kaolinite are also observed
Sample C: floodplain claystone containing Fe-illite, illite and kaolinite. The disrupted fabric indicates pedoturbation. Rootletting and rhizo-concretions are found with varying degrees of maturity throughout the claystones of the Schooner Formation (corresponding to Pedofacies 3 in Moscariello, 2003).
Sample D: floodplain and pedoturbated claystone comprising Fe-illite, illite and kaolinite with silt grade quartz grains. Pedogenesis is indicated by the disturbed fabric and the presence of rhizo-concretions (corresponding to Pedofacies 2 in Moscariello, 2003).
Lithotyping:
As textural information is preserved, individual ![]() cuttings
cuttings![]() particles can be grouped (lithotyped) by attributes such as size, mineralogy, mineral grain size and texture into populations of similar particle types (Fig. 3). This allows the percentage of each particle type present within each sample to be determined. Furthermore, a variety of data (such as modal mineralogy, mineral grain size data etc) can then be extracted
particles can be grouped (lithotyped) by attributes such as size, mineralogy, mineral grain size and texture into populations of similar particle types (Fig. 3). This allows the percentage of each particle type present within each sample to be determined. Furthermore, a variety of data (such as modal mineralogy, mineral grain size data etc) can then be extracted ![]() from
from![]() each lithotype grouping, or if required for individual
each lithotype grouping, or if required for individual ![]() cuttings
cuttings![]() particles. Lithotyping of
particles. Lithotyping of ![]() cuttings
cuttings![]() particles combined with data
particles combined with data ![]() from
from![]() core can be used in correlation. The lithotypes as measured in cutting samples correlate well with the lithologies observed over the cored intervals.
core can be used in correlation. The lithotypes as measured in cutting samples correlate well with the lithologies observed over the cored intervals.
Density and Porosity Characterisation:
An ideal, measured or inferred mineral density is assigned to each of the >500,000 analysis points. This allows the grain density (i.e. excluding porosity) to be calculated to a high degree of precision. In addition, a density value can also be assigned to porosity (e.g. that of fresh water, saline water, hydrocarbons etc) and bulk rock density, including porosity, can be extracted ![]() from
from![]() the dataset. Thus values for both cutting-derived density and porosity can be derived
the dataset. Thus values for both cutting-derived density and porosity can be derived ![]() from
from![]() each sample and plotted against depth to highlight vertical trends and compare with other reservoir characteristics such as composition and response to wireline logs.
each sample and plotted against depth to highlight vertical trends and compare with other reservoir characteristics such as composition and response to wireline logs.
Macro- to meso-porosity ![]() estimation
estimation![]() is also possible for core samples. During measurement, resin filled pores are marked as “internal background” or porosity and an area % value can be extracted. Porosity maps can also be extracted to allow visualisation of the pore network.
is also possible for core samples. During measurement, resin filled pores are marked as “internal background” or porosity and an area % value can be extracted. Porosity maps can also be extracted to allow visualisation of the pore network.
Two samples were examined in detail and high-resolution images were obtained to highlight several aspects which are usually obtained by detailed petrographic studies. This resulted in the following observations (Fig. 4):
Sample E: Fluvial channel ![]() sandstone
sandstone![]() , moderately well sorted with sub-angular to subrounded grains. The detrital mineralogy is dominated by detrital quartz grains. Authigenic phases include grain replacive and pore filling kaolinite and pore filling and locally grain replacive poikilotopic dolomite. The primary pore system is enhanced by the presence of oversized secondary pores resulting
, moderately well sorted with sub-angular to subrounded grains. The detrital mineralogy is dominated by detrital quartz grains. Authigenic phases include grain replacive and pore filling kaolinite and pore filling and locally grain replacive poikilotopic dolomite. The primary pore system is enhanced by the presence of oversized secondary pores resulting ![]() from
from![]() the dissolution of unstable silicate grains (e.g. feldspar). Inter-crystalline microporosity occurs between kaolinite platelets. Porosity: 10.2%; grain density: 2.644 g/cc.
the dissolution of unstable silicate grains (e.g. feldspar). Inter-crystalline microporosity occurs between kaolinite platelets. Porosity: 10.2%; grain density: 2.644 g/cc.
Sample F/G: Moderately sorted fluvial quartzose ![]() sandstone
sandstone![]() with weakly defined lamination. The pore network is well preserved with only minor, patchy authigenic phases including grain replacive to pore filling kaolinite and minor, highly localised poikilotopic siderite. G: Identical to “F” but optimised to highlight porosity. Porosity: 11.4%; grain density: 2.647 g/cc).
with weakly defined lamination. The pore network is well preserved with only minor, patchy authigenic phases including grain replacive to pore filling kaolinite and minor, highly localised poikilotopic siderite. G: Identical to “F” but optimised to highlight porosity. Porosity: 11.4%; grain density: 2.647 g/cc).
Conclusions:
The analysis of core and ![]() cuttings
cuttings![]() material
material ![]() from
from![]() the fluvial reservoirs of the Schooner field highlights the value of using ARQ technology for rock-typing and hence describing and quantifying reservoir composition, texture and properties (e.g. porosity, density, impact of diagenesis). The data obtained have been used to recognise vertical compositional differences and thus assist the stratigraphical subdivision and flow unit identification within the reservoir. High-resolution images of both core and
the fluvial reservoirs of the Schooner field highlights the value of using ARQ technology for rock-typing and hence describing and quantifying reservoir composition, texture and properties (e.g. porosity, density, impact of diagenesis). The data obtained have been used to recognise vertical compositional differences and thus assist the stratigraphical subdivision and flow unit identification within the reservoir. High-resolution images of both core and ![]() cuttings
cuttings![]() assist with the description of mineral composition and secondary mineral infill, ultimately providing useful information to distinguish sedimentary facies and their associated reservoir properties such as porosity and density.
assist with the description of mineral composition and secondary mineral infill, ultimately providing useful information to distinguish sedimentary facies and their associated reservoir properties such as porosity and density.
Overall this study demonstrates the potential of using ARQ technology for extended rock-typing and reservoir studies, by providing the possibility to extract maximum value ![]() from
from![]() uncored wells and using these data to reduce reservoir uncertainties associated with vertical and lateral reservoir facies and property distribution.
uncored wells and using these data to reduce reservoir uncertainties associated with vertical and lateral reservoir facies and property distribution.
References
Moscariello, A., 2003. United Kingdom Oil and Gas Fields, Commemorative Millennium Volume, Geological Society London, Memoir 20, 811-824.
Pearce, T.J., Wray, D., Ratcliffe, K., Wright, D.K. and Moscariello, A. 2005. Yorkshire Geological Society Volume 7, 147-164.
Stone, G. and Moscariello, A. 1999, SPE 56898, 8 pp
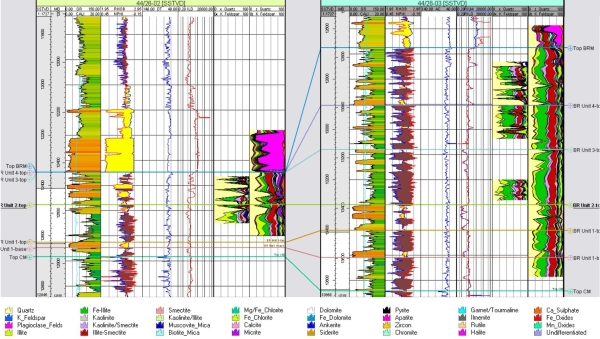 Fig. 1: vertical bulk mineralogy of fluvial reservoirs
 ![]() from
from![]() Schooner wells obtained with ARQ analysis.
Schooner wells obtained with ARQ analysis.
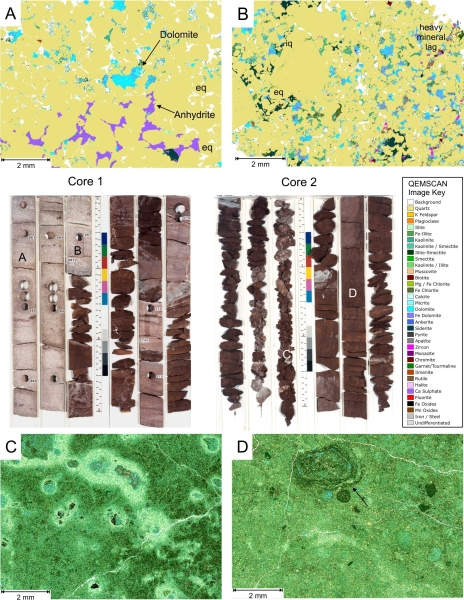 Fig. 2 core and ARQ images of textural analysis of cores samples
 ![]() from
from![]() four different facies types
four different facies types
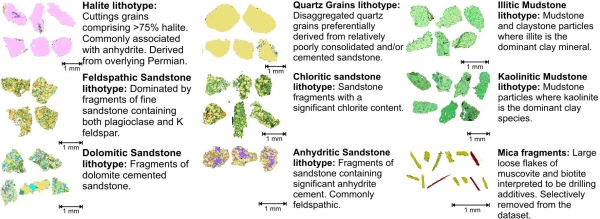 Fig. 3 Selected examples of lithotype particles identified during ARQ analysis.
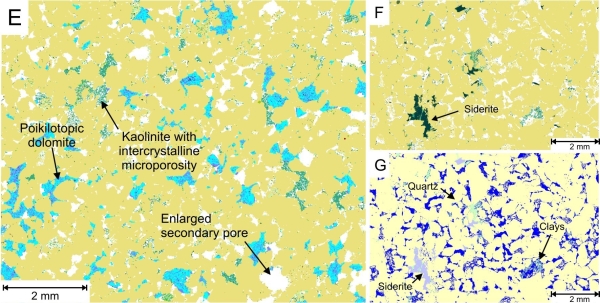 Fig. 4: Example images highlighting different styles of porosity and cementation.