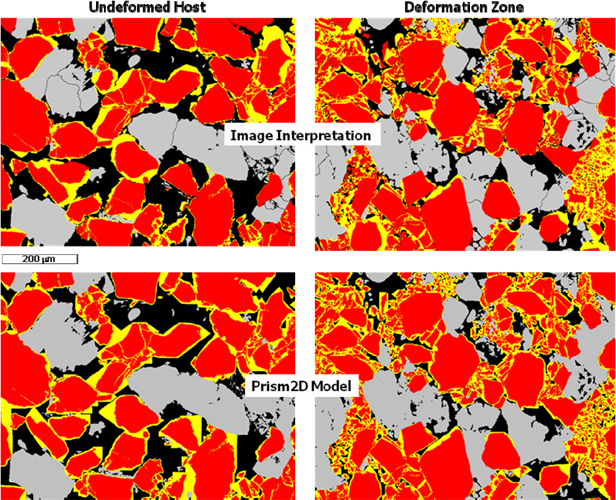
Figure 3. Comparison of quartz cement distribution (in yellow) and porosity distribution (black) in the interpreted images (above) and as modeled by Prism 2D (below). Monocrystalline quartz grains are shown in red and other solids are gray.
Figure 3. Comparison of quartz cement distribution (in yellow) and porosity distribution (black) in the interpreted images (above) and as modeled by Prism 2D (below). Monocrystalline quartz grains are shown in red and other solids are gray.