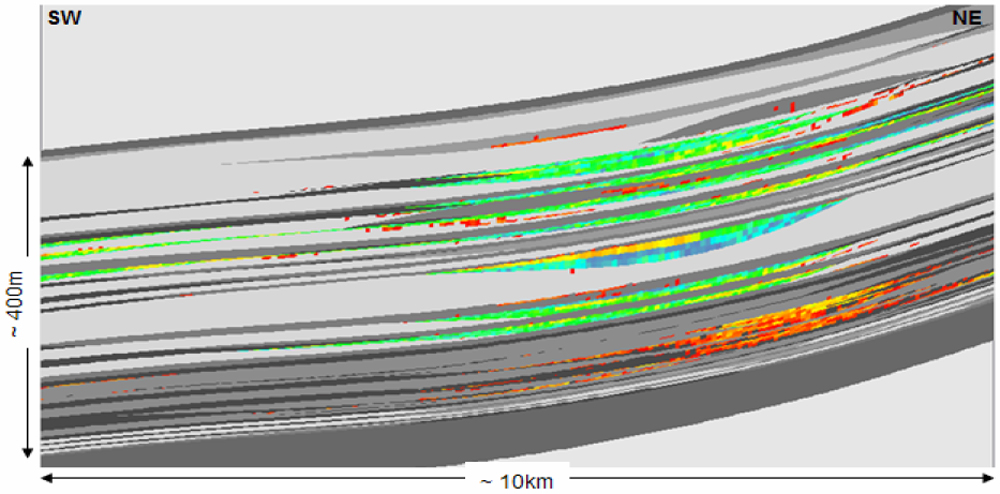
Figure 2. Schematic showing 2D slice through migration simulation result, showing hydrocarbon accumulations color-coded by saturation (red low; blue high). All lithofacies within the model are different types of clay-rich, fine-grained rocks ("shales").